ProSiebenSat.1 at a Glance
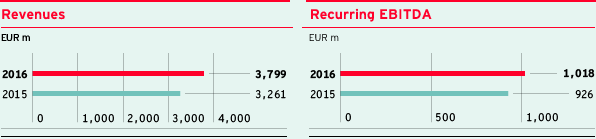
ProSiebenSat.1 Group is one of the most successful independent media companies in Europe with a strong lead in TV and digital market. The Group grows dynamically with revenues increasing by 17 % to EUR 3,799 million in 2016. At the same time, recurring EBITDA rose by 10 % to EUR 1,018 million. The Company employs 6,054 people in average. The most important revenue market is Germany. Here, the ProSiebenSat.1 share has been included into the German equity index DAX since March 2016.
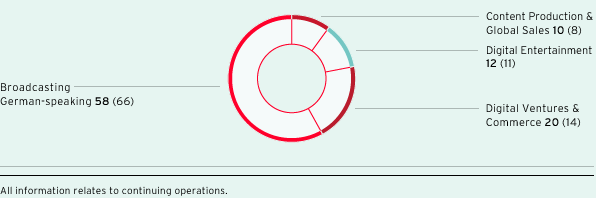
Advertising-financed free TV is the Group’s core business. The station family comprising SAT.1, ProSieben, kabel eins, sixx, SAT.1 Gold, ProSieben MAXX, and kabel eins Doku is the Number 1 in the German audience and TV advertising markets. The Group has tapped into an additional attractive business area through the distribution of its television channels in HD quality. At the same time, the Group successfully networks the wide reach of its TV business with a strong digital unit. Already today, ProSiebenSat.1 is Germany’s leading video marketer on the Internet and with maxdome or Studio71 one of the most successful providers of digital entertainment. However, the Internet is not only changing the entertainment industry, digital media also influence consumer behavior. This is why, ProSiebenSat.1 has built up a successful e-commerce business of digital platforms in recent years that is now one of the Group’s most important growth drivers. This broadcasting, digital entertainment and ventures & commerce portfolio is supplemented by the international program production and distribution company Red Arrow. Thus, ProSiebenSat.1 has a broadly diversified revenue and earnings base. By 2018, ProSiebenSat.1 intends to increase its revenues by EUR 2.15 billion up to around EUR 4.5 billion, compared to 2012.
Forecasts 2016 |
Actual figures 2016 |
Forecasts 2017 |
||||||||||||
|
||||||||||||||
|
+17 % |
Revenues |
|
|||||||||||
|
+3 % |
Broadcasting German-speaking |
|
|||||||||||
|
+19 % |
Digital Entertainment |
|
|||||||||||
|
+65 % |
Digital Ventures & Commerce |
|
|||||||||||
|
+38 % |
Content Production & Global Sales |
|
|||||||||||
|
+10 % |
Recurring EBITDA1 |
|
|||||||||||
|
+3 % |
Broadcasting German-speaking |
|
|||||||||||
|
–1 % |
Digital Entertainment |
|
|||||||||||
|
+33 % |
Digital Ventures & Commerce |
|
|||||||||||
|
+87 % |
Content Production & Global Sales |
|
|||||||||||
|
+10 % |
Underlying net income1 |
|
|||||||||||
1.5 – 2.5 |
1.9 |
Leverage ratio2 |
1.5 – 2.5 |
|||||||||||
|
28.0 % |
German TV audience market3 |
|
|||||||||||
Key figures of ProSiebenSat.1 Group – Part 1 |
||||
|
|
|
||
EUR m |
2016 |
2015 |
||
Revenues |
3,799 |
3,261 |
||
Revenue margin before income taxes (in percent) |
17.3 |
18.5 |
||
Total costs |
3,056 |
2,555 |
||
Operating costs1 |
2,804 |
2,355 |
||
Consumption of programming assets |
915 |
896 |
||
Recurring EBITDA2 |
1,018 |
926 |
||
Recurring EBITDA margin (in percent) |
26.8 |
28.4 |
||
EBITDA |
982 |
881 |
||
Reconciling items (net)3 |
–35 |
–44 |
||
EBIT |
777 |
730 |
||
Financial result |
–119 |
–126 |
||
Profit before income taxes |
658 |
604 |
||
Consolidated net profit (after non-controlling interests)4 |
402 |
391 |
||
Profit from discontinued operations (net of income taxes) |
–42 |
0 |
||
Underlying net income5 |
513 |
466 |
||
Basic earnings per share (underlying)6 |
2.379 |
2.18 |
||
Investments in programming assets |
992 |
944 |
||
Free cash flow |
–4 |
–1 |
||
Cash flow from investing activities |
–1,623 |
–1,522 |
||
Key figures of ProSiebenSat.1 Group – Part 2 |
||||||||||||||||||||||||
|
|
|
||||||||||||||||||||||
EUR m |
12/31/2016 |
12/31/2015 |
||||||||||||||||||||||
|
||||||||||||||||||||||||
Programming assets |
1,312 |
1,252 |
||||||||||||||||||||||
Equity |
1,432 |
943 |
||||||||||||||||||||||
Equity ratio (in percent) |
21.7 |
17.8 |
||||||||||||||||||||||
Cash and cash equivalents |
1,271 |
734 |
||||||||||||||||||||||
Financial liabilities |
3,185 |
2,675 |
||||||||||||||||||||||
Leverage7 |
1.9 |
2.1 |
||||||||||||||||||||||
Net financial debt |
1,913 |
1,940 |
||||||||||||||||||||||
Employees8 |
6,054 |
4,880 |
||||||||||||||||||||||

Group revenue share by segment