
Group Earnings
- For ProSiebenSat.1, 2016 is a new record year with revenues of EUR 3,799 million and recurring EBITDA of EUR 1,018 million.
- In recent months, the Group enlarged its portfolio and expanded as a result of strategic acquisitions, which had a major effect on the development of revenues and costs. ProSiebenSat.1 is focusing on investments that synergistically complement the portfolio and that are suitable for TV advertising.
ProSiebenSat.1 Group increased its consolidated revenues for 2016 to EUR 3,799 million. This is an increase of 17 % or EUR 538 million compared to the financial year 2015 and represents a new record high. In the financial year 2016 as well, the revenue growth was supported by all segments.
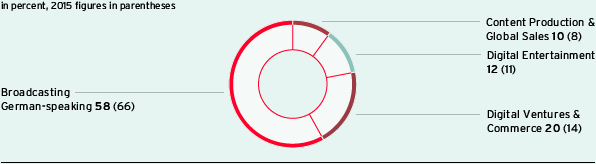
The segments Digital Ventures & Commerce and Content Production & Global Sales performed particularly dynamically (+65 % and +38 % respectively). These segments made the largest contributions to growth at EUR 303 million and EUR 99 million respectively. In the Broadcasting German-speaking TV segment, external revenues rose by 3 % or EUR 58 million to EUR 2,210 million. They therefore contributed 58 % of consolidated revenues (previous year: 66 %).
Group revenue share by segment (Fig. 60)

Other operating income amounted to EUR 34 million after EUR 25 million in the comparative period. The increase primarily reflects income from the sale of subsidiaries.
Total costs comprise the cost of sales, selling expenses, administrative expenses, and other operating expenses, further information can be found in the Notes, Note 6-9, from page 202 onwards.
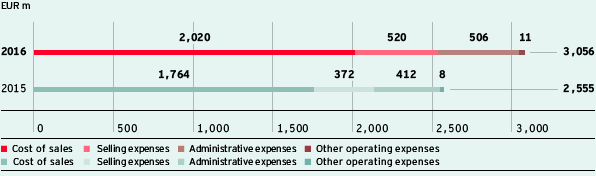
In recent months, the Group has expanded its Company portfolio through acquisitions. In this context, total costs increased by 20 % or EUR 501 million to EUR 3,056 million (Fig. 61):
- The majority of the year-on-year cost increase was due to a rise in the cost of sales by EUR 256 million or 15 % to EUR 2,020 million. The main reason was the expansion of the digital portfolio, whereby the cost level was primarily determined by the consolidation of the multi-channel network (MCN) Studio71 (previously: Collective Digital Studio; CDS) and various commerce platforms. In addition, acquisitions in the Content Production & Global Sales segment affected cost development. At the same time, the consumption of programming assets — the Group’s largest cost item — rose to EUR 915 million (previous year: EUR 896 million).
- Due to the expansion of the portfolio in the digital sector, selling expenses also increased by 40 % or EUR 148 million to EUR 520 million.
- Administrative expenses amounted to EUR 506 million, corresponding to an increase of 23 % or EUR 93 million. Higher personnel expenses were the main reason for the increase in administrative expenses. In addition, higher amortization of purchase price allocations occurred due to portfolio measures. Depreciation of property, plant and equipment also led to an increase in administrative expenses.
Total costs (Fig. 61)

Depreciation and amortization increased primarily due to acquisitions and growth. Against this background, amortization from purchase price allocations in particular increased by EUR 23 million to EUR 55 million. In total, depreciation and amortization, which are part of the total costs, went up by EUR 54 million to EUR 206 million. Before depreciation, amortization and expense adjustments, operating costs amounted to EUR 2,804 million (previous year: EUR 2,355 million). This equates to an increase of 19 % compared to the financial year 2015. The cost item relevant for recurring EBITDA is operating costs. The following table shows a reconciliation of operating costs from total costs (Fig. 62):
Reconciliation of operating costs (Fig. 62) |
||||||
|
|
|
||||
EUR m |
2016 |
2015 |
||||
|
||||||
Total costs |
3,056 |
2,555 |
||||
Expense adjustments |
46 |
50 |
||||
Depreciation and amortization1 |
206 |
151 |
||||
Operating costs |
2,804 |
2,355 |
||||
Recurring EBITDA adjusted for reconciling items increased by 10 % to EUR 1,018 million (previous year: EUR 926 million). The corresponding recurring EBITDA margin was 26.8 % (previous year: 28.4 %). The margin development reflects mix effects from the distribution of revenues by segment: The Group’s target is to generate additional revenue potential, particularly in the digital industry, and to become more independent overall from the highly profitable but economically sensitive free TV business. The digital business is growing very dynamically, but is subject to different earning structures than TV. In 2016, the Group generated a revenue share totaling EUR 1,589 million (previous year: EUR 1,109 million) or 42 % (previous year: 34 %) from outside of the Broadcasting German-speaking segment. This was a higher share than in 2015. The Digital Entertainment, Digital Ventures & Commerce and Content Production & Global Sales segments’ contribution to external recurring EBITDA rose to EUR 347 million (previous year: EUR 265 million).
At the same time, EBITDA rose by a substantial 12 % to EUR 982 million as a result of the positive revenue momentum (previous year: EUR 881 million). It includes reconciling items of minus EUR 35 million (previous year: EUR –44 million), which comprise various expenses and income. For 2016, expenses of EUR 46 million were recognized, of which in particular EUR 22 million in connection with reorganizations (previous year: EUR 19 million), EUR 16 million for M&A projects (previous year: EUR 20 million) and EUR 4 million for legal claims (previous year: EUR 1 million). In addition, other reconciling effects of EUR 11 million, primarily for severance payments in connection with the termination of Executive Board activities and to cover tax risks, are included as expenses in the reconciling items. This item also includes cost-reducing measurement effects for cash-settled share-based payment in the amount of EUR 9 million. This is offset by income adjustments of EUR 11 million, of which EUR 9 million is attributable to deconsolidation effects (previous year: EUR 1 million), mainly from the sale of the Games business at EUR 6 million. The expenses for reorganization are primarily attributable to the Broadcasting German-Speaking segment, while the M&A-related reconciling items mainly relate to the Digital Ventures & Commerce segment.
Reconciliation of recurring EBITDA (Fig. 63) |
||||||||
|
|
|
||||||
EUR m |
2016 |
2015 |
||||||
|
||||||||
Profit before income taxes |
658 |
604 |
||||||
Financial result |
–119 |
–126 |
||||||
EBIT |
777 |
730 |
||||||
Depreciation and amortization1 |
206 |
151 |
||||||
thereof from purchase price allocations |
55 |
32 |
||||||
EBITDA |
982 |
881 |
||||||
Reconciling items (net)2 |
35 |
44 |
||||||
Recurring EBITDA |
1,018 |
926 |
||||||
Notes, Notes 11 – 13 “Interest Result,” “Result from Investments Accounted for Using the Equity Method and Other Financial Result,” “Income taxes,” page 203.
The financial result comprises the interest result, the other financial result and income from investments accounted for using the equity method and amounted to minus EUR 119 million (previous year: EUR –126 million). The main reason for this improvement is the development of the other financial result, which amounted to minus EUR 34 million (previous year: EUR –45 million) and is dominated by opposite items.
Firstly, the other financial result reflects positive valuation adjustments to the shares in ZeniMax of EUR 30 million; ProSiebenSat.1 Group sold its shares in ZeniMax as part of the reorganization of the Games business. Secondly, the Group reports lower impairments on financial investments of minus EUR 44 million (previous year: EUR –63 million). In contrast, valuation adjustments of earn-out and put option liabilities total minus EUR 24 million (previous year: EUR 4 million). In addition, the other financial result for 2015 included comparatively high income from the remeasurement of shares, which were previously accounted for using the equity method. Here, the acquisition of control over SMARTSTREAM.TV and Collective Digital Studio (CDS; now Studio71) and Amorelie resulted in income totaling EUR 35 million in 2015. By contrast, a positive measurement effect on the shares of Stylight of EUR 9 million was recognized in the financial year 2016: ProSiebenSat.1 Group has increased its share to 100 % in Juli 2016.
Due to higher revenues and the improvement of the financial result, pre-tax profit increased to EUR 658 million. This represents growth of 9 % or EUR 55 million compared to the previous year. Income tax expense amounted to EUR 206 million (previous year: EUR 208 million); the tax rate was 31.3 % (previous year: 34.4 %).
The developments described increased consolidated net profit from continuing operations by 14 % to EUR 452 million; in the same period of the previous year, this profit figure amounted to EUR 396 million. The earnings after taxes from discontinued operations amounted to minus EUR 42 million (previous year: EUR 0 million). It contains tax expenses of EUR 40 million. In the second quarter 2016, ProSiebenSat.1 Media SE settled an additional tax claim including interest and penalties for former companies in Sweden.
Further information on the earnings per share can be found in the Notes, “Summary of key accounting policies“ in the section “Earnings per share”, page 253.
At the same time, underlying net income increased by 10 % to EUR 513 million (previous year: EUR 466 million); the basic underlying earnings per share therefore rose 7 % to EUR 2.37 (previous year: EUR 2.18). Underlying net income is adjusted for various reconciling items, including amortization from purchase price allocations and impairments on financial investments (Fig. 64).
Reconciliation of underlying net income from continuing operations (Fig. 64) |
||||
|
|
|
||
EUR m, after taxes |
2016 |
2015 |
||
Consolidated net profit (after non-controlling interests) |
444 |
391 |
||
Amortization from purchase price allocations (after tax) |
40 |
22 |
||
Taxes included therein |
–18 |
–10 |
||
Impairments on other financial investments |
43 |
39 |
||
Taxes included therein |
–1 |
–/– |
||
Remeasurement of interests accounted for using the equity method in connection with initial consolidations |
–9 |
–26 |
||
Taxes included therein |
–/– |
9 |
||
Reassessment of tax risks |
4 |
20 |
||
Taxes included therein |
–1 |
16 |
||
Valuation effects from financial derivatives |
3 |
–/– |
||
Taxes included therein |
–1 |
–/– |
||
Valuation adjustment to shares in ZeniMax Media Inc. |
–30 |
23 |
||
Taxes included therein |
–/– |
–/– |
||
Put options/earn-outs |
26 |
–3 |
||
Taxes included therein |
–7 |
–3 |
||
Group Share Plan |
–6 |
–/– |
||
Taxes included therein |
3 |
–/– |
||
Other effects |
–1 |
1 |
||
Taxes included therein |
–4 |
–4 |
||
Underlying net income |
513 |
466 |
||
Selected key figures of ProSiebenSat.1 Group for the financial year 2016 (Fig. 65) |
||||
|
|
|
||
|
ProSiebenSat.1 |
|||
EUR m |
2016 |
2015 |
||
Revenues |
3,799 |
3,261 |
||
Operating costs1 |
2,804 |
2,355 |
||
Total costs |
3,056 |
2,555 |
||
Cost of sales |
2,020 |
1,764 |
||
Selling expenses |
520 |
372 |
||
Administrative expenses |
506 |
412 |
||
Other operating expenses |
11 |
8 |
||
EBIT |
777 |
730 |
||
Recurring EBITDA2 |
1,018 |
926 |
||
Reconciling items (net)3 |
–35 |
–44 |
||
EBITDA |
982 |
881 |
||
Consolidated net profit attributable to shareholders of ProSiebenSat.1 Media SE |
444 |
391 |
||
Underlying net income4 |
513 |
466 |
||
Selected key figures of ProSiebenSat.1 Group for the fourth quarter of 2016 (Fig. 66) |
||||||||||||||
|
|
|
||||||||||||
|
ProSiebenSat.1 |
|||||||||||||
EUR m |
Q4 2016 |
Q4 2015 |
||||||||||||
|
||||||||||||||
Revenues |
1,254 |
1,087 |
||||||||||||
Operating costs1 |
872 |
735 |
||||||||||||
Total costs |
958 |
809 |
||||||||||||
Cost of sales |
628 |
545 |
||||||||||||
Selling expenses |
166 |
124 |
||||||||||||
Administrative expenses |
161 |
135 |
||||||||||||
Other operating expenses |
3 |
4 |
||||||||||||
EBIT |
307 |
289 |
||||||||||||
Recurring EBITDA2 |
392 |
357 |
||||||||||||
Reconciling items (net)3 |
–17 |
–14 |
||||||||||||
EBITDA |
375 |
343 |
||||||||||||
Consolidated net profit attributable to shareholders of ProSiebenSat.1 Media SE |
174 |
138 |
||||||||||||
Underlying net income4 |
219 |
194 |
||||||||||||