
Group Financial Position and Performance
- ProSiebenSat.1 Group took advantage of conditions on capital markets in order to further optimize its financing structure. The equity ratio climbed to 22 %.
- In November 2016, the Group increased its equity by EUR 515 million (gross) by issuing new shares and increased its financial headroom for strategic acquisitions in this way.
- ProSiebenSat.1 is pursuing a long-term financing policy for its M&A activities with a target range for leverage between 1.5 and 2.5. In 2016, the Group maintained a leverage ratio of 1.9.
Financing Structure and Borrowings
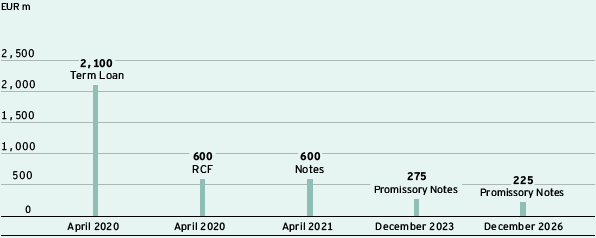
ProSiebenSat.1 Group practices active financial management and has benefited from the attractive conditions on the financial markets in recent years: In addition to a capital increase in the fourth quarter of 2016 of around 6.5 % with gross issue proceeds totaling around EUR 515 million, the Company took out three syndicated promissory notes totaling EUR 500 million in December. They have maturities of seven years (EUR 225 million at a fixed interest rate and EUR 50 million at a variable interest rate) and ten years (EUR 225 million at a fixed interest rate). The promissory notes complement the existing loan agreement comprising a term loan of EUR 2,100 million and a revolving credit facility (RCF) of EUR 600 million. Interest payable on the term loan and the RCF are variable and based on Euribor money market rates plus an additional credit margin. In addition, ProSiebenSat.1 has notes in the amount of EUR 600 million. The notes are listed on the regulated market of the Luxembourg stock exchange (ISIN DE000A11QFA7). The coupon of the notes is 2.625 % per annum. All the above financing instruments are unsecured. We use our financing measures to optimize our financing portfolio with regard to instrument and investor diversification and maturity extension (Fig. 67).
Rating of ProSiebenSat.1 Group: Ratings represent an independent assessment of an entity’s credit quality. The rating agencies do not take ProSiebenSat.1 Group’s facilities agreement or notes into account in their credit ratings.
Debt financing instruments and maturities as of December 31, 2016 (Fig. 67)

ProSiebenSat.1 Group hedges potential risks from changes in variable interest rates with derivative financial instruments in the form of interest rate swaps and interest rate options. The Group is continuously observing the development of financial markets and adjusting its derivatives to the interest rate environment if required. At the end of the financial year 2016, the proportion of fixed interest was approximately 98 % of the entire long-term financing portfolio (December 31, 2015: approx. 78 %). The average fixed rate of the interest rate swaps was 1.88 % per annum as of December 31, 2016. The average interest rate ceiling of the interest rate caps was 0.0 % per annum.
As of December 31, 2016, ProSiebenSat.1 Group’s debt capital had a share of 78 % in total equity and liabilities (December 31, 2015: 82 %). At 62 % or EUR 3,185 million, the majority of debt capital was attributable to non-current and current financial liabilities (December 31, 2015: 61 % or EUR 2,675 million). The amounts of the debt instruments that existed in 2015 did not change year-on-year. As in the previous year, no drawings had been made on the RCF as of December 31, 2016.
ProSiebenSat.1 Group has also concluded lease contracts for property at the Unterföhring site. Under IFRS, these are largely classified as finance leases. This real estate is capitalized as property, plant and equipment and the respective leasing obligations are recognized as other financial liabilities. The real estate leases end in 2019 at the earliest. There are also smaller-scale leases for technical equipment. ProSiebenSat.1 Group reported liabilities for finance leases totaling EUR 72 million as of December 31, 2016 (previous year: EUR 82 million). There were no other significant off-balance sheet financing instruments.
Financing Analysis
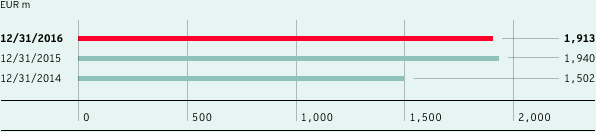
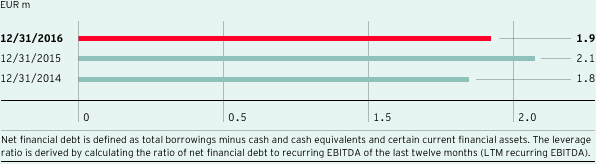
The leverage ratio was still within the target range as of December 31, 2016. Net financial debt amounted to EUR 1,913 million (December 31, 2015: EUR 1,940 million) (Fig. 68). As a result, the ratio of net financial debt to recurring EBITDA of the last twelve months resulted in a leverage ratio of 1.9 after 2.1 in the previous year (Fig. 69). The leverage ratio is a key indicator for Group-wide financial and investment planning. The target is a value between 1.5 and 2.5. Despite the M&A activities, financial debt improved slightly by 1 % or EUR 27 million year-on-year; this development is based on the increase in cash and cash equivalents. They increased to EUR 1,271 million (previous year: EUR 734 million) also due to the capital increase in the fourth quarter.
Group net financial debt (Fig. 68)

Ratio net financial debt to LTM recurring EBITDA (leverage ratio) (Fig. 69)

Principles and objectives of financial management (Fig. 70) |
|
|
|
The Company’s financial management is centrally run by the Group Finance & Treasury department. This department controls financial management throughout the Group and pursues the following objectives: |
|
> |
to secure financial flexibility and stability, in other words, to maintain and optimize the Group’s funding ability, |
> |
to ensure that the entire Group remains solvent by managing its liquidity efficiently across the organization, |
> |
to manage financial risks by using derivative financial instruments. |
The Group financial management covers the capital structure management and Group-wide funding, cash and liquidity management, and the management of market price risks, counterparty risks and credit default risks. This includes the following tasks: |
|
> |
Capital structure: In connection with capital structure management at ProSiebenSat.1 Group, managing the leverage ratio is given particular priority. The Group has defined a target range of 1.5 to 2.5 and takes into account factors such as the level of market receptivity, funding terms and conditions, flexibility or restrictions, diversification of the investor base and maturity profiles in its choice of suitable financing instruments. ProSiebenSat.1 Group manages its funds on a centralized basis. |
> |
Cash and liquidity management: As part of its cash and liquidity management, the Group optimizes and centralizes cash flows and secures liquidity across the Group. Cash pooling is an important tool here. Using rolling, Group-wide liquidity planning ProSiebenSat.1 Group captures and forecasts both operating cash flows and cash flows from non-operating activities, thus deriving liquidity surpluses or requirements. Liquidity requirements are covered either by existing cash positions or the revolving credit facility (RCF). |
> |
Management of market price risks: The management of market price risks comprises centrally managed interest rate and currency management. Cash instruments as well as derivatives such as conditional and unconditional forward transactions are deployed. These instruments are used for hedging purposes and serve to limit the effects of interest and currency volatility to consolidated net profit and cash flow. |
> |
Management of counterparty and credit default risks: The management of counterparty and credit default risks centers on trading relationships and creditor exposure to financial institutions. When entering into trading transactions, ProSiebenSat.1 Group pays attention to ensuring that business is widely diversified involving counterparties of sufficiently high credit quality. For this purpose, the Group draws on external ratings supplied by international agencies. The Group’s risk with respect to financial institutions arises primarily from its investment of cash and cash equivalents and from its use of derivatives as part of its interest-rate and currency management activities. |
Analysis of Liquidity and Capital Expenditure
ProSiebenSat.1 Group’s statement of cash flows shows the generation and use of cash flows (Fig. 71). A distinction is made between cash flow from operating activities, cash flow from investing activities and cash flow from financing activities. Cash and cash equivalents shown in the statement of cash flows correspond to the cash and cash equivalents reported on the statement of financial position as of December 31, 2016.
Statement of cash flows (Fig. 71) |
||||||||
|
|
|
|
|
||||
EUR m |
Q4 2016 |
Q4 2015 |
2016 |
2015 |
||||
Result from continuing operations |
177 |
139 |
452 |
396 |
||||
Result from discontinued operations |
0 |
3 |
–42 |
0 |
||||
Cash flow from continuing operations |
658 |
618 |
1,915 |
1,785 |
||||
Cash flow from discontinued operations |
0 |
–2 |
–2 |
–2 |
||||
Change in working capital |
18 |
–47 |
–14 |
–12 |
||||
Dividends received |
0 |
0 |
6 |
7 |
||||
Income tax paid |
–47 |
–58 |
–210 |
–178 |
||||
Interest paid |
–12 |
–18 |
–82 |
–82 |
||||
Interest received |
0 |
0 |
3 |
1 |
||||
Cash flow from operating activities of continuing operations |
618 |
496 |
1,619 |
1,521 |
||||
Cash flow from operating activities of discontinued operations |
0 |
0 |
–42 |
–2 |
||||
Cash flow from investing activities of continuing operations |
–602 |
–419 |
–1,623 |
–1,522 |
||||
Cash flow from investing activities of discontinued operations |
–/– |
17 |
–/– |
17 |
||||
Free cash flow of continuing operations |
16 |
77 |
–4 |
–1 |
||||
Free cash flow of discontinued operations |
0 |
17 |
–42 |
15 |
||||
Free cash flow |
16 |
93 |
–46 |
14 |
||||
Cash flow from financing activities |
942 |
417 |
584 |
242 |
||||
Effect of foreign exchange rate changes on cash and cash equivalents |
3 |
0 |
0 |
8 |
||||
Change in cash and cash equivalents |
962 |
511 |
537 |
264 |
||||
Cash and cash equivalents at beginning of reporting period |
309 |
224 |
734 |
471 |
||||
Cash and cash equivalents of continuing operations at end of reporting period |
1,271 |
734 |
1,271 |
734 |
||||
Detailed information on off-balance-sheet investment obligations can be found in the Notes, Note 29 “Other financial obligations,” page 232.
In the financial year 2016, ProSiebenSat.1 Group generated cash flow from operating activities of EUR 1,619 million compared to EUR 1,521 million in the previous year. The 6 % increase is primarily attributable to the positive earnings performance.
The cash flows from investing activities resulted in an investing cash flow of minus EUR 1,623 million for the financial year 2016. Cash outflow thus increased by 7 % or EUR 102 million compared to the previous year.
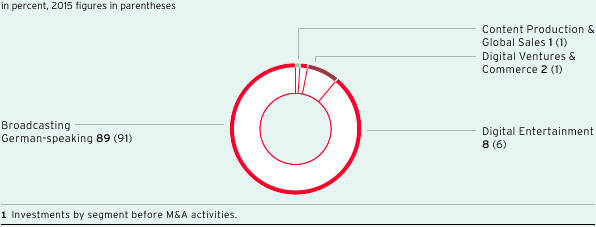
Investments by segment1 (Fig. 72)

Programming investments are a focal point in investing activities. In addition to the purchasing of licensed formats and commissioned productions, in-house formats secure the Group’s programming supply. They are based on the development and implementation of own ideas and, unlike commissioned productions, are produced primarily for broadcasting in the near future. For this reason, they are recognized immediately as an expense in cost of sales and are not considered as an investment.
- Investments in programming assets: Most of the programming investments (97 %) were made in the Broadcasting German-speaking segment (previous year: 97 %), 59 % for the acquisition of licensed programming (previous year: 53 %) and 40 % for commissioned productions (previous year: 47 %). Overall, cash outflow for the acquisition of programming rights increased by 5 % or EUR 48 million to EUR 992 million.
- Other intangible assets and property, plant and equipment: EUR 124 million was spent on other intangible assets in the financial year 2016. The 47 % or EUR 40 million increase primarily resulted from a higher investment volume for internally generated intangible assets, advance payments for intangible assets and software licenses. 48 % was attributable to the Digital Entertainment segment (previous year: 44 %) and 33 % to the TV segment (previous year: 31 %).
Investments in property, plant and equipment were 6 % or EUR 2 million lower than in the previous year and amounted to EUR 36 million. The majority resulted from investments in technical facilities, leasehold improvements at the Unterföhring site and advance payments for property, plant and equipment; these are primarily reported in the Broadcasting German-speaking segment. - Cash outflow from additions to the scope of consolidation: Due to the acquisitions in the Digital Ventures & Commerce and Content Production & Global Sales segments cash outflow from additions to the scope of consolidation was nearly on a par with the previous year at EUR 420 million (previous year: EUR 426 million).
Assets resulting from initial consolidations are not reported as segment-specific investments. Funds used for the acquisition of the initially consolidated entities are shown as “cash outflow from additions to the scope of consolidation.”
Due to the higher investment volume overall, free cash flow fell slightly to minus EUR 4 million. The previous year’s figure for free cash flow was minus EUR 1 million.
Cash flow from financing activities amounted to EUR 584 million compared to EUR 242 million in the previous year. This development reflects net cash outflow of EUR 1,002 million in connection with financing measures. ProSiebenSat.1 used the advantageous conditions on the financial markets to increase its equity by issuing new shares; the Group also issued promissory notes in the fourth quarter of 2016. In contrast, the dividend payment led to cash outflow of EUR 386 million (previous year: EUR 342 million).
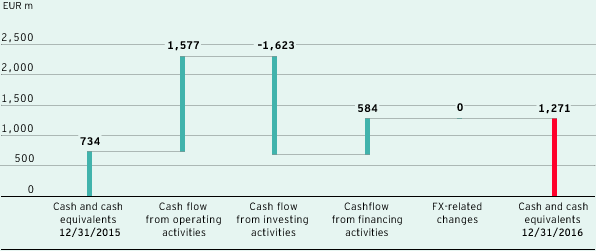
The cash flows described resulted in a significant increase in cash and cash equivalents year-on-year. At EUR 1,271 million, the cash and cash equivalents were 73 % or EUR 537 million higher than the previous year’s figure of EUR 734 million (Fig. 73).
Changes in cash and cash equivalents (Fig. 73)

Analysis of Assets and Capital Structure
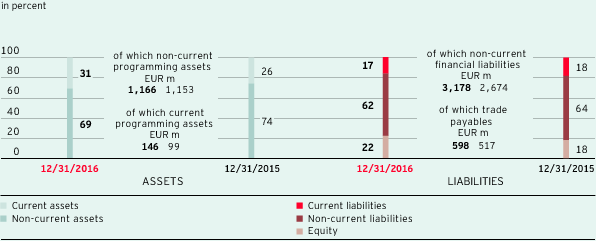
As of December 31, 2016, total assets amounted to EUR 6,603 million compared to EUR 5,310 million on December 31, 2015. The 24 % rise in total assets reflects consolidation effects and financing measures. The most significant value changes to key items in the statement of financial position are described below. There were no material structural changes in the statement of financial position compared to the previous year. The asset and capital structure is solid and the Group has a comfortable level of liquidity (Fig. 74).
Structure of the statement of financial position (Fig. 74)

Information on capital costs can be found in the Notes, Note 16 "Goodwill," page 211.
- Current and non-current assets: As of December 31 , 2016, goodwill increased by 13 % to EUR 1,860 million (December 31, 2015: EUR 1,649 million). As a result, its share in total assets was 28 % (December 31, 2015: 31 %). This was due to the initial consolidation of various majority interests, including PARSHIP ELITE Group in the fourth quarter of 2016. In addition, other intangible assets increased significantly in this context and amounted to EUR 817 million as of December 31, 2016 (December 31, 2015: EUR 553 million). Other non-current financial and non-financial assets rose by 12 % to EUR 342 million (December 31, 2015: EUR 307 million). This development is mainly attributable to the rise in other investments and non-current trade receivables. At EUR 148 million, other current financial and non-financial assets were also above the level of the previous year (December 31, 2015: EUR 137 million).
Programming assets increased by 5 % year-on-year and amounted to EUR 1,312 million (December 31, 2015: EUR 1,252 million). This corresponds to a share of 20 % of total assets (December 31, 2015: 24 %). In addition to goodwill, programming assets are among ProSiebenSat.1’s most important assets and comprise non-current and current programming assets.
Current trade receivables increased by 16 % and amounted to EUR 446 million (December 31, 2015: EUR 383 million). At the same time, cash and cash equivalents increased significantly by 73 % or EUR 537 million to EUR 1,271 million compared to December 31, 2015. This high level of liquidity reflects the development of cash flows. - Equity: Equity increased to EUR 1,432 million (+52 % or EUR 489 million compared to December 31, 2015) while the corresponding equity ratio increased to 22 % (December 31, 2015: 18 %). The issuance of shares strengthened the capital base by EUR 515 million (gross).
- Current and non-current liabilities: Non-current and current financial liabilities reported in debt increased by 19 % and amounted to EUR 3,185 million compared to EUR 2,675 million as of December 31, 2015. This was mainly due to promissory notes of EUR 500 million. Thereby, the Group has placed its financing on a broader basis. In addition, deferred taxes on assets from purchase price allocations for acquisitions and outstanding contingent purchase price payments for majority interests acquired in 2016 led to an increase in current and non-current liabilities. Overall, liabilities and provisions went up by 18 % to EUR 5,172 million compared to December 31, 2015 (December 31, 2015: EUR 4,367 million).
Accounting assumptions and estimates (Fig. 75) |
|
When applying accounting principles, recognizing income and expenses and presenting items in the financial statements, assumptions and estimates need to be made to a certain extent. Detailed information on the use of assumptions and estimates is disclosed in the relevant Notes. |