Development of the TV and Online Advertising Market
In 2016, the TV advertising market reflected the generally positive domestic economy in Germany. According to Nielsen Media Research, gross TV advertising investment in 2016 as a whole increased by 8.0 % to EUR 15.091 billion (previous year: EUR 13.979 billion). At EUR 4.983 billion (previous year: EUR 4.676 billion), a large portion of the investment was made in the fourth quarter, which is usually characterized by the highest market volume.
In 2016, gross market growth was attributable especially to higher TV investment in the health and pharmaceuticals (+18.4 %), vehicles (+16.9 %) and services (+16.8 %) sectors. At the same time, TV is promoting structural change and has made further gains in share compared to other media. In the reporting period, 48.2 % of advertising investment in the German market went on TV advertising (previous year: 47.4 %). By contrast, print lost ground, with its gross share decreasing by 1.1 percentage points to 28.1 % (Fig. 49).
Media mix German gross advertising market (Fig. 49)

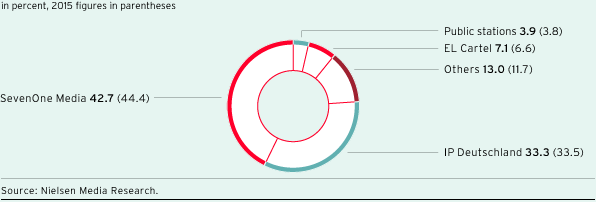
Market shares German gross TV advertising market (Fig. 50)

In this market environment, according to Nielsen Media Research, ProSiebenSat.1 Group generated gross TV advertising revenues of EUR 6.447 billion compared to EUR 6.201 billion in the previous year. This equates to growth of 4.0 % compared to financial year 2015. In the fourth quarter of 2016, revenues increased by 1.4 % to EUR 2.089 billion (previous year: EUR 2.059 billion). For 2016 as a whole, this resulted in a market share of 42.7 %; in the fourth quarter, ProSiebenSat.1 achieved a market share of 41.9 % (same periods of the previous year: 44.4 % and 44.0 % respectively). The Group therefore remains the market leader in the German TV advertising market (Fig. 51 – 52). The year-on-year decline in market share is primarily attributable to the entry of new market participants which has led to a certain fragmentation. Secondly, in 2016, the broadcast of major sports events took place on public stations, such as the European soccer championship and the Summer Olympic Games.
TV advertising markets in Germany, Austria and Switzerland on a gross basis (Fig. 51) |
||||||||||||||
|
|
|
|
|
||||||||||
in percent |
Development of the TV advertising market in Q4 2016 |
Development of the TV advertising market in 2016 |
||||||||||||
|
||||||||||||||
Germany |
6.6 |
8.0 |
||||||||||||
Austria |
8.7 |
8.9 |
||||||||||||
Switzerland |
1.5 |
3.6 |
||||||||||||
|
|
|
|
|
||||||||||
|
|
|
|
|
||||||||||
in percent |
Market share of |
Market share of |
Market share of |
Market share of |
||||||||||
Germany |
41.9 |
44.0 |
42.7 |
44.4 |
||||||||||
Austria |
36.4 |
36.9 |
36.6 |
37.0 |
||||||||||
Switzerland |
26.6 |
30.1 |
26.9 |
29.2 |
||||||||||
Gross advertising market data from Nielsen Media Research are important indicators for an objective assessment of advertising market development. However, gross data allow only limited conclusions to be drawn about actual advertising revenues as they do not take into account discounts, self-promotion or agency commission. In addition, the figures from Nielsen Media Research also include TV spots from media-for-revenue-share and media-for-equity transactions. ProSiebenSat.1 estimates that the development of the TV advertising market in Germany on a net basis was also positive; 2016 as a whole developed in line with our expectations. Official data on the net TV advertising market will be published by the German Advertising Federation (Zentralverband der deutschen Werbewirtschaft — ZAW) in May 2017.
Nielsen Media Research designates gross figures for the online advertising market in Germany, excluding among others Google/Youtube, Facebook.
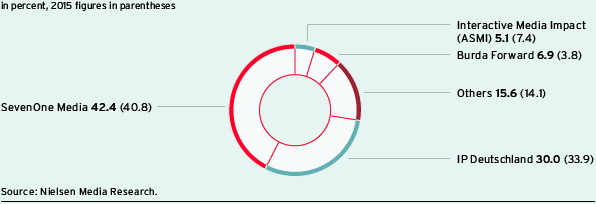
According to Nielsen Media Research the advertising market for in-stream video ads in Germany continued developing positively: On a gross basis, the market volume increased by 14.2 % to EUR 577.4 million in 2016 (previous year: EUR 505.5 million). In-stream video ads are forms of Internet video advertising shown before, after or during a video stream. By selling them, ProSiebenSat.1 Group generated gross revenues of EUR 244.6 million in the past financial year (previous year: EUR 206.1 million). This corresponds to a year-on-year increase of 18.7 % and a gross market share of 42.4 % (IP Deutschland: 30.0 %) (Fig. 52). Overall, investments in online forms of advertising rose by 2.7 % to EUR 3.454 billion (previous year: EUR 3.365 billion). In addition to in-stream videos, the online advertising market also includes display ads such as traditional banners and buttons.
Shares German gross online advertising market for in-stream ads (Fig. 52)
